Background
Deciding to add a new feature to a plugin can be challenging, because it is difficult to know what could be useful. Getting it right means useful functionality has been added, which creates value for the customer and business. Getting it wrong can be a net loss, and continue to be a burden to maintain while remaining largely unused. Worst yet...how do you even know if it is being used? What we need is some metric by which we can see if a feature is used by the client base. Google Analytics (from here on referred to as GA) to the rescue!
With GA we can see how often a feature is used and discern usage patterns. It could also help diagnose possible sticking points. This in time will help us understand where we should be spending our resources for maximum effect. I should mention that there are several alternatives to GA. We decided to use GA because they have well defined documentation, and some of the groundwork for our project was already researched in a previous spike. Google's size also invokes some confidence that they will continue to provide the service. What we want to avoid is maintenance as a result of a service becoming unusable. We are planning on integrating GA to most of our plugins, so a reliable persisting service is a requirement.
Introduction
It is important to state that no confidential or sensitive information is collected. None of the analytical data can be associated with any one Confluence instance. We are only capturing usage patterns. In normal use cases GA can track and report website traffic. The challenging bit is to try and implement this functionality in a plugin for Confluence, with as little code as possible added to the plugin itself. We might want to do this so we can track the usages of different parts of a plugin. In this case we want to measure actions and macro usage related to our plugin. This GA project will be loaded as a dependency in the plugin where we want to implement analytics.
Capturing plugin actions with a Servlet Filter
What we required was a generic way of capturing plugin actions while ignoring Confluence actions. XWork Interceptors might provide similar functionality, however we did run into some issues and time constraints prohibited us from fully exploring it further. The Servlet filter only intercepts those actions which are related to our plugin,for instance to see how often the configuration section of the plugin is entered. We can adjust this behaviour by changing the url-pattern associated with the plugin actions specified in the atlassian-plugin.xml file.
Care should be taken not to capture Confluence actions. This can be avoided by adopting a clear naming scheme to your own plugin actions. The url-pattern specified for the Servlet filter does not have to be complex. In the Servlet filter we are intercepting the HTTP request analysing the uri, establishing which action is being called, and then recording it. For those actions which have multiple responsibilities we are also recording the parameter for each HTTP request so we can distinguish between requests. For example: .../confluence/admin/pluginNameHere/configuration-add-edit.action?createConfig=true&name= here we might only want to record /pluginNameHere/configuration-add-edit.action and createConfig. This will depend on how your plugin was designed and how you wish to record analytic data.
public void doFilter(ServletRequest servletRequest, ServletResponse servletResponse, FilterChain filterChain) throws IOException, ServletException {
     if (analyticsManager.isAnalyticsEnabled()) {
         HttpServletRequest request = (HttpServletRequest) servletRequest;
         String valueToSend = findUri(request);
         if (!valueToSend.equals(NO_URI_FOUND)) {
            String requestParameters = findLinkQueryString(request);
            if (!StringUtils.isEmpty(requestParameters)) {
               valueToSend = valueToSend.concat(" ").concat(findLinkQueryString(request));
            }
            CommonAnalyticsData analytics = new CommonAnalyticsData(pluginHolder, "Action: " + valueToSend);
            googleAnalyticsService.sendDataToAnalytics(analytics);
         }
     }
     filterChain.doFilter(servletRequest, servletResponse);
}
The first bit of code simply checks if analytics is enabled and proceeds if it is. Then we are capturing the uri and formatting it into something we can understand when observed in the analytics data. We then send the formatted data, plugin name and version to our own buffer and dispatch service.
Client allowed to disable analytics
To comply with Google's terms and conditions, the user should be allowed to disable analytics. We implement the switch as a System Property which is true by default. The user can disable analytics at the command prompt when launching Confluence.
Delivering your payload to Google
Google has a nice guide to help understand the process.
Managing the sending of data to Google
Google's free service only allows a certain amount of hits to their servers per month based on the terms of service. We want to remain under the limit to make use of the free service, without potentially loosing out on analytic data once the threshold is reached. To do this we implement a buffer which sends one large payload when the threshold is reached.
 public void addDataToBuffer(CommonAnalyticsData analyticsData) {
        Integer value = 1;
        if (dataToSend.containsKey(analyticsData)) {
            value = dataToSend.get(analyticsData) + 1;
        }
        dataToSend.put(analyticsData, value);
    }

    public boolean isBufferFull() {
        int totalItemsToSend = 0;
        for (Map.Entry<CommonAnalyticsData, Integer> entry : dataToSend.entrySet()) {
            totalItemsToSend += entry.getValue();
        }
        return totalItemsToSend >= pluginHolder.getLicenseTier().getMaxUsers() * 10;
    }

    public void emptyBuffer() {
        LOGGER.debug("empty the buffer");
        dataToSend.clear();
Here we are just collecting all the analytics data, incrementing a counter, and then comparing the counter against our customised threshold.
Determining the analytics buffer size
It is important to realise that a 1000 user instance would generate a lot more analytical data than a 10 user instance. Therefore we want to adjust the buffer threshold to accommodate the size of the Confluence user base. In simple terms all we need to do is find out what licence was purchased and use that information to adjust the threshold.
public LicenseTier getLicenseTier() {
        final ServiceReference serviceReference = bundleContext.getServiceReference("com.atlassian.upm.api.license.PluginLicenseManager");
        if (serviceReference == null) {
            return LicenseTier.TEN;
        }
        try {
            final Object pluginLicenseManager = bundleContext.getService(serviceReference);
            if (pluginLicenseManager != null) {
                try {
                    Object optionLicense = call(pluginLicenseManager, "getLicense");
                    if (!isTrue(call(optionLicense, "isDefined"))) {
                        return LicenseTier.TEN;
                    }
                    Object optionUsers = call(call(optionLicense, "get"), "getMaximumNumberOfUsers");
                    if (optionUsers.toString().equals("none()")) {
                        return LicenseTier.UNLIMITED;
                    }
                    Integer users = (Integer) call(call(call(optionLicense, "get"), "getMaximumNumberOfUsers"), "get");
                    return LicenseTier.getLicenseTier(users);
                } catch (Exception e) {
                    LOGGER.error("Unable to obtain license status from Atlassian licensing", e);
                }
            }
            return LicenseTier.TEN;
        } finally {
            bundleContext.ungetService(serviceReference);
        }
    }
Here we are querying the Atlassian UPM service for information about the license tier the instance is using. It's important because if the threshold is high for a small instance you might not get the analytic data. Alternatively if the threshold is low for a large instance, you might reach your service limit.
Sorting the analytic data
Google provides 4 categories to use. Below we show how we decided to arrange the captured analytic data, and include a picture of how it appears in GA.
Category: Confluence Version, e.g. Confluence 5.8.4 Action: Plugin Version, e.g. Forms for Confluence 5.1-beta2-SNAPSHOT Label: Represents the type of data retrieved: e.g. Macro Usage, Action Triggered, or License Tier Value: Aggregated results, e.g. Macro Usage: ClearMacro - 57 times.
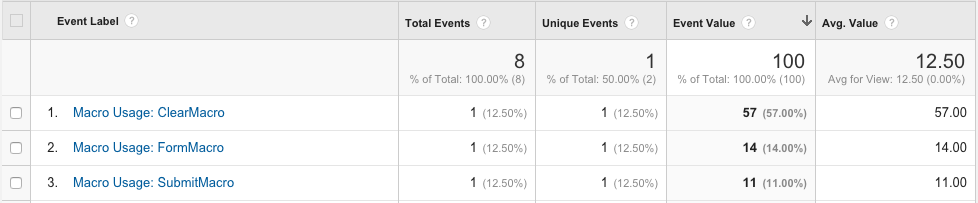
Above we see that the ClearMacro was used 57 times, and that this data was delivered in one payload.
Capturing analytics from a macro using Polymorphism
If you want to collect data related to the usage of a macro, your macro should extend the AbstractAnalyticsMacro provided by your analytics project. This abstract class is the one fired when a macro is executed. It delegates the execution to the sub-classes using the abstract method renderMacro, and then collects and sends analytic data in the "finally" clause.
public abstract class AbstractAnalyticsMacro implements Macro {

    [..]

    @Override
    @RequiresFormat(Format.Storage)
    public String execute(Map<String, String> params, String body, ConversionContext context) throws MacroExecutionException {
        try {
            return renderMacro(params, body, context);
        } finally {
            if (!"preview".equals(context.getOutputType())) {
                CommonAnalyticsData analytics = new CommonAnalyticsData(pluginHolder.getPluginNameAndVersion(), "Macro Usage: " + this.getClass().getSimpleName());
                googleAnalyticsService.sendDataToAnalytics(analytics);
            }
        }
    }

    protected abstract String renderMacro(Map<String, String> params, String body, ConversionContext context) throws MacroExecutionException;
}
Conclusion
In the coming weeks we should see analytics data trickling in which will assist us in making data driven decisions. This project is still a work in progress, and I expect it to evolve over time as we make adjustments. I appreciate not all points were touched on, but we did try to make it short and sweet.
- 04 Oct 2016 » Checking user permissions from REST calls
- 28 Sep 2016 » Creating a custom Confluence Blueprint
- 06 Sep 2016 » ReactJS in Forms for Confluence Connect
- 25 Apr 2016 » Migrating to ES6 in Atlassian Add-ons
- 17 Mar 2016 » All kinds of things I learnt trying to performance test against Fisheye/Crucible
- 24 Dec 2015 » Adaptavist’s Holiday Gift of Atlassian Deployment Automation
- 17 Dec 2015 » Getting a Custom Field value safely
- 07 Dec 2015 » Putting Google Analytics to work with plugins for Confluence
- 02 Dec 2015 » Devoxx Voting, A retrospective
- 25 Nov 2015 » Some things I've learnt about SingleSelect
- 15 Oct 2015 » Using SOY for JIRA actions
- 26 Sep 2015 » Object Reflection in Groovy
- 22 Sep 2015 » Introducing Adaptavist Labs